Australia’s General Insurance Industry Snapshot
- Policies and Claims: The industry manages 86 million general insurance policies , including 18.2 million motor-related policies and 12.4 million home and homeowner policies. In the 2024 financial year, $49.9 billion was paid out in claims. Motor-related claims totaled $14.1 billion , and home and contents claims amounted to $8.6 billion.
- Companies and Employees: There are 88 general insurance companies operating in Australia , employing 46,000 people.
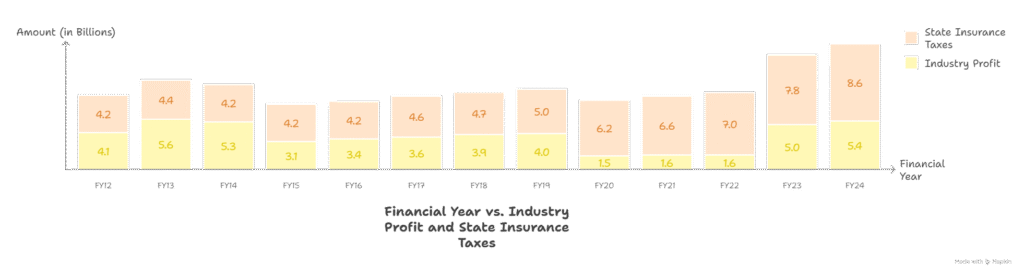
- Financials: The industry’s profit for FY24 was $5.1 billion. In the same period, customers paid $8.6 billion in state taxes.
How Insurance Works
Insurance functions as an annual contract where a policyholder pays a premium into a shared fund. This fund is then used by the insurer to compensate policyholders for losses or damages as specified by their policy. Insurers assess risks through a process called underwriting to determine premiums. The funds collected from premiums also cover reinsurance, underwriting, and operational expenses. Insurers also earn income from low-risk, liquid investments. The typical allocation of a home insurance premium is as follows: claims take up the largest portion at 43%, followed by taxes at 20%, reinsurance at 18%, operating expenses at 14%, and profit at 5%.
What’s Impacting Premium Prices?
- Inflation, Labour, and Materials: The average cost of a new home has increased by 29% since 2019, from roughly $345,000 to $444,000. In Queensland, new home costs rose from $310,000 to $450,000, an annual increase of around 10%. Building materials are 30% more expensive than three years ago. From 2019 to 2024, motor claims rose by 42% due to factors such as more expensive cars and parts. In 2024, there were 28,000 trades and blue-collar job vacancies, double the pre-pandemic level, with shortages in key motor repair roles.
- Development in High-Risk Locations: Approximately 1.4 million properties face some risk of flooding, and about 300,000 have a severe to extreme annual risk. Since 2010, the population of Southeast Queensland and northern NSW has grown by nearly 1 million people. Insurers received roughly 500,000 extreme weather claims from these regions since 2022.
- Extreme Weather Costs: Insured extreme weather costs over the last five years hit $22.5 billion, averaging $4.5 billion per year. This is a 67% increase compared to the previous five-year period. In 2023, Australian insurers experienced increases of up to 30% in reinsurance costs, which had risen to 20-year highs on the global market.
- Taxes: Taxes on insurance premiums can add 20% to 40% to the cost. In 2023-24, state governments collected approximately $8.6 billion in insurance taxes, which was $3.5 billion more than the industry’s total profit.
Insurer Profits vs. State Taxes
The chart below compares industry profit and state insurance taxes from FY12 to FY24. The data shows that while insurer profits fluctuate, state insurance taxes have generally trended upward
The Australian general insurance industry has undergone significant transformation over the past 15 years, with consistent premium growth across most major lines of business and fluctuating profitability driven by economic, environmental, and global events.
An analysis of APRA industry statistics from 2008 to 2022 (excluding reinsurance premiums) highlights the resilience of the market and the varied performance across product lines.
Premium Growth: Sustained Expansion Despite Market Shocks
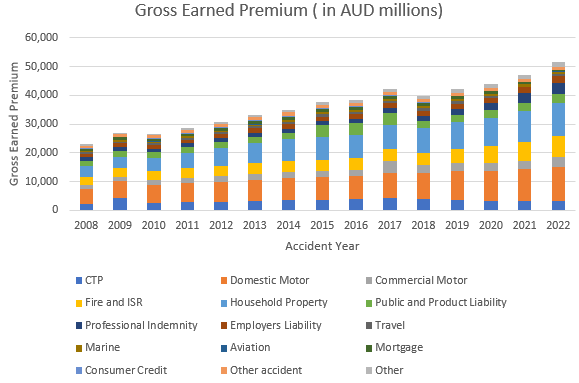
Total gross earned premiums (GEP) in the Australian general insurance market rose from $22.9 billion in 2008 to $51.4 billion in 2022, representing a compound annual growth rate (CAGR) of 6.0%. This long-term growth has been underpinned by:
- Inflationary effects on repair, replacement, and construction costs
- Rising asset values, particularly in motor vehicles and property
- Increased risk awareness and regulatory requirements across industries
- Catastrophe-driven repricing, especially in property-related lines
Key Premium Drivers by Product Line
Observations:
- Motor & Property dominance – Domestic Motor and Household Property together accounted for 45% of total GEP in 2022.
- Public & Product Liability – Significant jumps in 2015 (+20% YoY) and 2022 (+17% YoY) likely reflect higher litigation risk, broader coverage, and repricing for claim cost escalation.
- Fire & ISR – Strong growth post-2018 aligns with increased catastrophe risk pricing following severe bushfire and flood events.
- Travel Insurance collapse – Premiums fell by over 80% in 2020–21 during COVID-19 border closures, before rebounding +250% in 2022, though still below pre-pandemic levels.
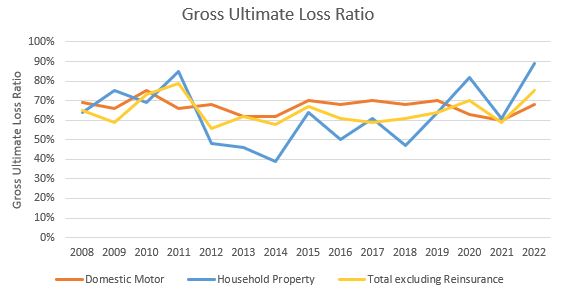
Loss Ratios: Profitability Under Pressure
The ultimate loss ratio—claims and claims handling expenses divided by earned premiums—provides insight into underwriting profitability.
- Market average loss ratio in 2022: 75 (i.e., 75 cents in claims per premium dollar).
- Ratios above 1.0 indicate underwriting losses, often due to catastrophes, economic shocks, or inadequate pricing.
Notable Trends by Line of Business
- Domestic Motor – Stable, ranging 60–75%, reflecting competitive pricing discipline in a mature market.
- Household Property & Fire/ISR – Highly volatile due to weather-related catastrophes. Major spikes:
- 2010–11: Queensland floods & Cyclone Yasi
- 2013: Bushfires in NSW and severe storms
- 2020: Black Summer bushfires followed by floods
- Employers’ Liability – Consistently high ratios (>0.70) with a 2015 spike to 106% likely from large claims and legal shifts in workplace injury compensation.
- Commercial Motor – Sharp deterioration in 2022 to 126%, potentially linked to supply chain disruptions, higher repair labour costs, and increased accident severity.
- Travel Insurance – Pandemic years saw loss ratios above average despite collapsing premiums, due to concentrated high-value claims (trip cancellations, medical evacuations).
*Gross ultimate losses are based on projections and may fluctuate based upon actual experience
Market Dynamics and Outlook
The industry remains well-capitalized but faces persistent cost pressures from:
- Climate change, driving higher catastrophe frequency/severity
- Inflation in claims costs (materials, labour, medical)
- Evolving legal environments, particularly in liability lines
- Global economic uncertainty impacting investment income
Insurers have responded with rate hardening, stricter underwriting, and revised policy terms, particularly in property and liability lines. The premium growth trajectory is expected to continue, but maintaining underwriting profitability will require careful catastrophe exposure management and claims cost control.
Conclusion
The Australian general insurance market from 2008 to 2022 tells a story of resilience amid volatility—steady premium growth counterbalanced by episodic profit shocks from natural disasters and global crises. Motor and property remain the backbone of the market, but future profitability will hinge on insurers’ ability to adapt pricing, reinsurance, and risk management strategies to an evolving climate and economic landscape.
Source- Insurance Council of Australia and APRA


